WHERE ARE YOU ON THE MAINTENANCE MATURITY CURVE?
Most maintenance programs fall somewhere between reactive and scalable, but few know exactly where they land. This infographic gives you a fast, visual guide to assess your maturity level.
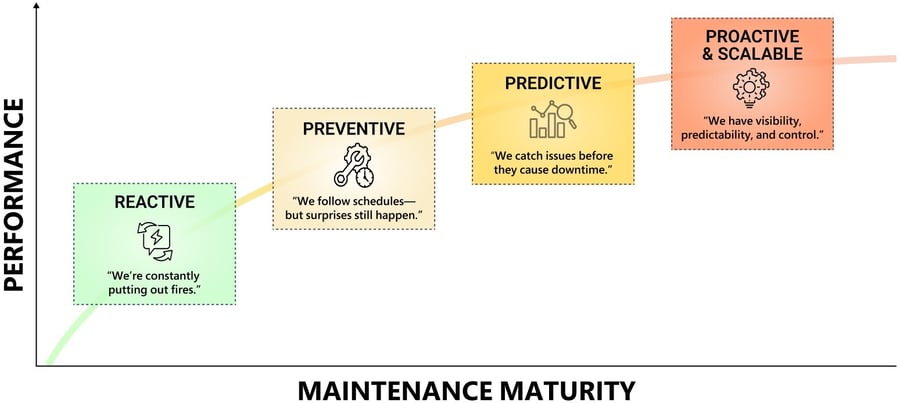
REACTIVE
Symptoms
- Equipment is fixed only after it fails.
- Most maintenance is unplanned or emergency-based.
- No sensor-based monitoring in place.
- Teams rely heavily on tribal knowledge.
- CMMS (if it exists) is often inaccurate or underused.
- No formal asset criticality ranking.
Risks
- High labor and repair costs.
- Frequent unplanned downtime.
- Maintenance value is hard to prove.
You’re likely here if:
- Emergency work dominates the backlog.
- Techs troubleshoot based on feel, not data.
- There’s no centralized view of machine condition.
PREVENTIVE
Symptoms
- Work orders follow OEM intervals or fixed schedules.
- PMs are logged in CMMS, but often not optimized.
- Condition data is limited, manually collected, or inconsistent.
Risks
- Wasted labor on non-critical tasks.
- Failures still occur between checks.
- Skilled labor is stretched across priorities.
You’re likely here if:
- Teams question whether the PM schedule reflects real risk.
- IR, ultrasound, and lube data are siloed or vendor-owned.
- Failure history isn’t tracked across systems.
PREDICTIVE
Symptoms
- Sensors on key assets feed real-time data.
- Alerts and trends drive maintenance actions.
- Root causes are tracked and shared.
- Vibration routes, IR, ultrasound, oil sampling, and MCA may be performed by in-house analysts or third-party providers.
Advantages
- Fewer surprise breakdowns.
- More efficient technician time.
- Lower parts, labor, and production loss.
You’re likely here if:
- You’ve piloted PdM on select assets.
- Analysts validate alerts and advise actions.
- Maintenance plans are informed by actual equipment behavior.
PROACTIVE
Symptoms
- Site-wide or enterprise-level condition monitoring in place.
- Data feeds planning, staffing, and strategic decisions.
- Maintenance tasks are prioritized by risk and value.
Advantages
- Downtime is rare and explainable.
- Maintenance is focused and right-sized.
- Teams operate with shared data and confidence.
You’re likely here if:
- You know what’s critical and what’s not.
- Analysts collaborate with your team in real-time.
- You’ve tied avoided failures to cost savings.
Download the Maintenance Maturity Self-Assessment
Take the next step with our self-scoring worksheet. In just 5 minutes, you can benchmark your maintenance program across:
- Strategy and Planning
- CMMS and Data Accuracy
- Tech Stack and Monitoring Methods
- People, Roles and Capabilities
- Measurable Results and Responsiveness
BUILDING A STRATEGY FOR PDM? START HERE.
Jumping into predictive maintenance without a clear foundation can create more confusion than clarity. In this article, we break down what true PdM readiness looks like—from systems to staffing—and how to avoid the most common missteps.